Visualize the flow of your application right within VS Code with Mermaid
Many a time, while in the process of developing a particular process or solution as a whole, we get tempted to quickly jump on the implementation of the process, rather than visualising the same. As the solution continues to branch out, complexity arises. Many ifs and buts come. In this way, we either get stuck at some point or deliver something which isn’t optimised.
No matter how tiny a process is or how many steps are involved in the execution of the process, the first step should be to design an algorithm (in the form of a Flowchart or any other format) for the process, to develop software smoothly and efficiently.
Almost every developer uses VS Code nowadays. The number of extensions which it has in its marketplace is overwhelming. You don’t have to leave your editor to find a diagramming tool.
Today I will discuss about an extension called “Markdown Preview Mermaid Support”, which you can use right within your VS Code, as an extension to quickly draw a FlowChart, Sequence Diagram and many more (Check out the official documentation- https://mermaid.js.org/intro/). It is developed by “Mermaid”, a diagramming and charting tool.
Installation
To install the extension, navigate to the “Extensions” section and search “Markdown Preview Mermaid Support”.

As you can see, I already have it installed on my system.
Now create a markdown file in any folder that will be treated as a project directory.

As you can see, I have already created one, named “README.md” in my project directory “markdown-preview-mermaid-support-demo”.
A mermaid configuration for a flowchart is nothing but a code snippet written using markdown syntax, enclosed in a code block starting with the prefix “mermaid”.
Add this snippet to the markdown file you have just created.
```mermaid
```
Press “CTRL + Shift + V”/”CMD + Shift + V” to preview the markdown file, for visualizing the changes in real-time.

You will notice some errors saying that some syntax error in the graph has been detected. That is because we haven’t included any mermaid code snippets yet.
Today, we will design the algorithm for a function which finds whether a number is even. If the number is even or odd, “True” or “False” will be printed on the console respectively. Sounds boring? I can’t help :). Because today we are here to grab the basics of Mermaid, and keep things simplified.
Now include the code snippet
flowchart TD;within the codeblock, as shown below.

As we have talked earlier, you can create various types of diagrams in Mermaid. here in the above code, we are specifying that we are creating a flowchart with a classical top-down approach view, denoted by “TD”.
Now add this statement
Start --> IN(Take a number as input);after the previous statement, as shown below.
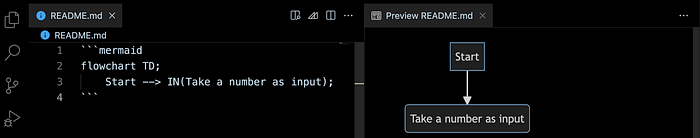
As you can understand from the diagram on the right-hand side, the first node of the flowchart is the “Start” node. The next node is taking a number through user input.
Though, there are a few things to notice in the code statement.
- Each configured node can have two types of names: An actual name and a display name (The name that you see in the diagrammatic view of the flowchart). If the display name is not specified, the actual name is treated as a display name.
- If we don’t explicitly specify the type of node, the node is by default it will be a process node.
- You can explicitly indicate the type of node (process node, decision node etc.). In that case, you must provide both the actual and display names. Otherwise, Mermaid cannot parse the statement. For example, if I want to explicitly specify that I want a node to be a decision node I can write the actual name of the node, followed by a pair of opening and closing curly braces, within which I will provide the display name.
- You can configure any number of flows from a particular node.
Start --> Input(Take a string as user input);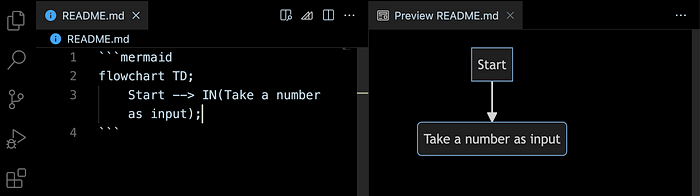
Here, in this example, I explicitly specify that the second node (with the actual name as “Input” and the display name as “Take a string as user input”) is a process node, by enclosing the display name within parenthesis. For a decision node, you have to use curly braces instead of parenthesis.
Let’s go through the previous statement which you included.
Usually, each flowchart design starts with a “Start” node indicating that the execution of the process has been started, and ends with a “Stop” node indicating that the execution of the process has been completed. Let’s go through the previous statement which you included.
In the statement, I have configured the first node as the “Start” node for which I have given a name “Start”, acting as both the actual and display names. For the second node, I have given the actual name as “IN”, and enclosed the display name “Take a number as input” within a pair of parentheses, to explicitly specify that it is a process node. Finally, I have used a “ →” connector to join the two nodes. I have also used a semicolon to denote the end of the statement, which is optional.
Next, we have to divide this number by 2 and store the remainder (Since 2 is the smallest positive even natural number, and if we can divide any number by 2 fully, without leaving any remainder, we can say that it is an even number. Otherwise, it will be an odd number).
For that, we have to include another node. We will denote this node as “R” (An abbreviation for the remainder).
Update the previous statement which you had included, as shown below.
Start --> IN(Take a number as input) --> R(Divide the number by 2 and store the remainder);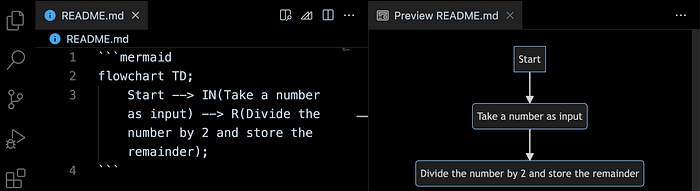
Now we have to check whether the remainder is equal to 0 or not. For that, we have to include a decision node as the fourth node.
Update the previous statement which you had included, as shown below.
Start --> IN(Take a number as input) --> R(Divide the number by 2 and store the remainder) --> REZ{Is remainder equal to 0?};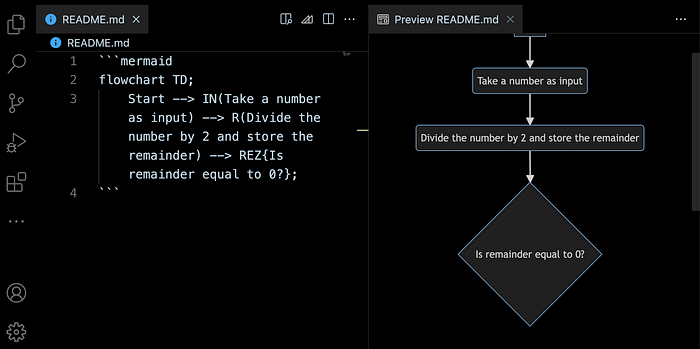
Now, every decision node in a flowchart contains two flows: one that satisfies the condition mentioned in the decision node, and the other, which doesn’t satisfy it.
Include two more statements after the previous statement, as shown below.
REZ --> |Yes| PE(Print even);
REZ --> |No| PO(Print odd);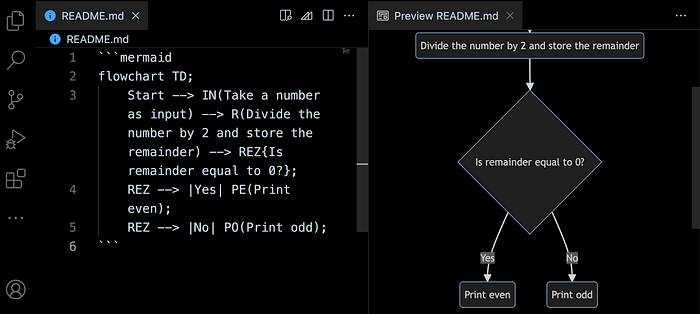
In the above two statements, we configure two flows from the node REZ. One as a positive flow, connecting to a process node which prints that the number is even, and the other as a negative flow, connecting to a process node which displays that the number is odd, by naming the flows as “Yes” and “No” respectively (You can give any names). It is to note that, to name a flow, we must enclose it within “|” symbol and put it between the connector and the next node.
Finally update the last two statements to connect them to a “Stop” node, as shown below.
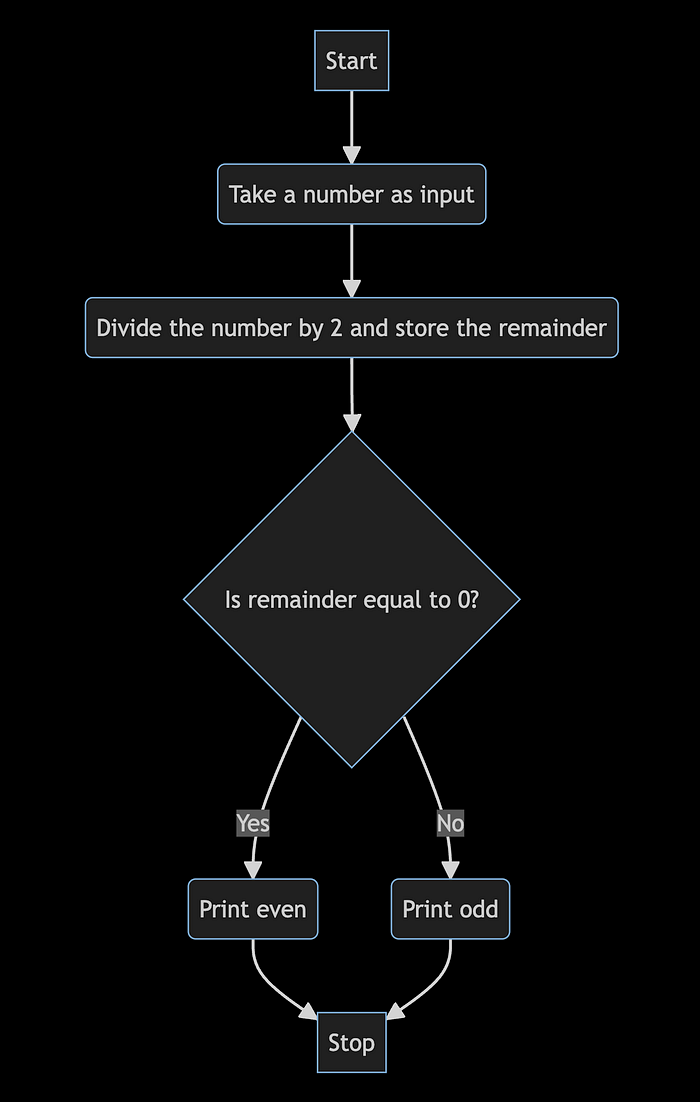
REZ --> |Yes| PE(Print even) --> Stop;
REZ --> |No| PO(Print odd) --> Stop;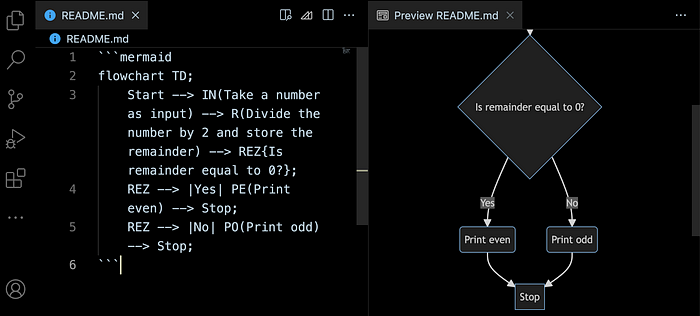
Voilà! We have designed the entire flowchart which looks like this.
But there is so much more to it! To explore this tool more, you have to go through their documentation.
You can find this project here: https://github.com/tirthyakamaldasgupta/markdown-preview-mermaid-support-demo
I apologize in advance for making this article a bit lengthy. I have intentionally kept it as it is for beginners to understand in depth as well. Hope you like this article.